
DA0-001 Practice Questions
CompTIA Data+ Certification Exam
Last Update 4 days ago
Total Questions : 396
Dive into our fully updated and stable DA0-001 practice test platform, featuring all the latest CompTIA Data+ exam questions added this week. Our preparation tool is more than just a CompTIA study aid; it's a strategic advantage.
Our free CompTIA Data+ practice questions crafted to reflect the domains and difficulty of the actual exam. The detailed rationales explain the 'why' behind each answer, reinforcing key concepts about DA0-001. Use this test to pinpoint which areas you need to focus your study on.

The senior management team at a company receives a detailed sales report at the end of each quarter. The report is several pages long and includes data from dozens of offices across the country. The team wants a better way to get a quick snapshot of what is included in the report. Which of the following modifications would best meet this requirement?
A data analyst is performing a data merge within a spreadsheet using the tables below:
https://www.bing.com/images/blob?bcid=S1XCF9p02M4GjpbGxHj0lrIaj9sw.....4c 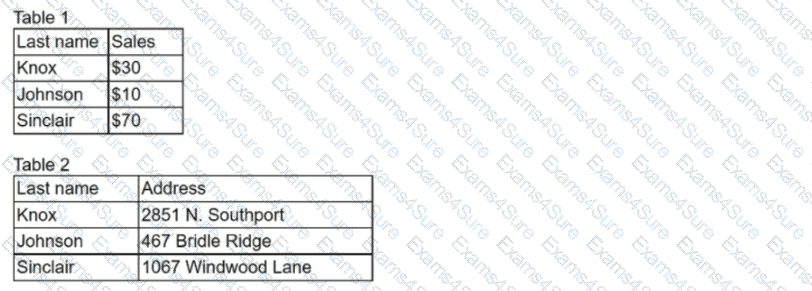
The analyst is attempting to pull the addresses from Table 2 into Table 1 using the last names and is receiving an error message. Which of the following steps can the analyst perform to fix the error?
A financial institution is reporting on sales performance to a company at the account level. Due to the sensitive nature of the government the does il with, some account information is not shown. Which of the following fields should be masked?
An analyst needs to provide a chart to identify the composition between the categories of the survey response data set:
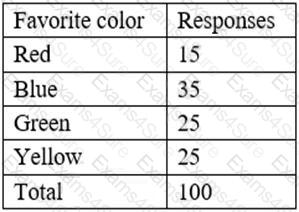
Which of the following charts would be BEST to use?
Which of the following is the first step an analyst should perform upon receiving a business request for analysis?
After completing web scraping, which of the following file formats needs to be parsed?
Encryption is a mechanism for protecting data.
When should encryption be applied to data?
Choose the best answer.
A data analyst was asked to create a visual representation of sales for the first quarter of 2020. Which of the following visualizations should be used when a time element is present?
An analyst wants to include a graph in a quarterly sales report that shows the comparison between two quantitative variables. Which of the following visual diagrams can the analyst use to most effectively represent this relationship?