
DA0-001 Practice Questions
CompTIA Data+ Certification Exam
Last Update 4 days ago
Total Questions : 396
Dive into our fully updated and stable DA0-001 practice test platform, featuring all the latest CompTIA Data+ exam questions added this week. Our preparation tool is more than just a CompTIA study aid; it's a strategic advantage.
Our free CompTIA Data+ practice questions crafted to reflect the domains and difficulty of the actual exam. The detailed rationales explain the 'why' behind each answer, reinforcing key concepts about DA0-001. Use this test to pinpoint which areas you need to focus your study on.

Which one of the following values will appear first if they are sorted in descending order?
An analyst needs to join two tables of data together for analysis. All the names and cities in the first table should be joined with the corresponding ages in the second table, if applicable.
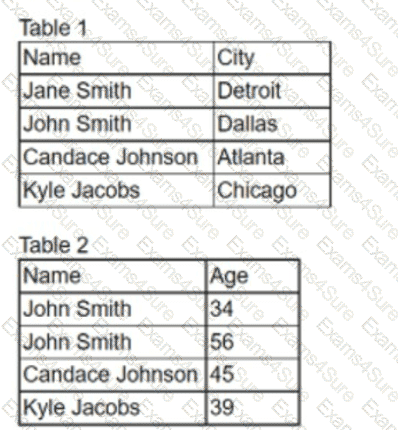
Which of the following is the correct join the analyst should complete. and how many total rows will be in one table?
Joseph is interpreting a left skewed distribution of test scores. Joe scored at the mean, Alfonso scored at the median, and gaby scored and the end of the tail.
Who had the highest score?
An analyst is preparing a report that contains weather data. The temperatures are shown in Fahrenheit. but they must be reported in Celsius. Which of the following should the analyst do to fix this issue?
Q3 2020 has just ended, and now a data analyst needs to create an ad-hoc sales report that demonstrates how well the Q3 2020 promotion went versus last year's Q3 promotion.
Which of the following date parameters should the analyst use?
Which of the following should be accomplished NEXT after understanding a business requirement for a data analysis report?
A gambler thinks that a coin is fair and is equally likely to turn up heads or tails when the coin is flipped. Which of the following tests should the gambler use to fest this hypothesis?
An analyst is designing a dashboard to determine which site has the highest percentage of new customers. The analyst must choose an appropriate chart to include in the dashboard. The following data is available:
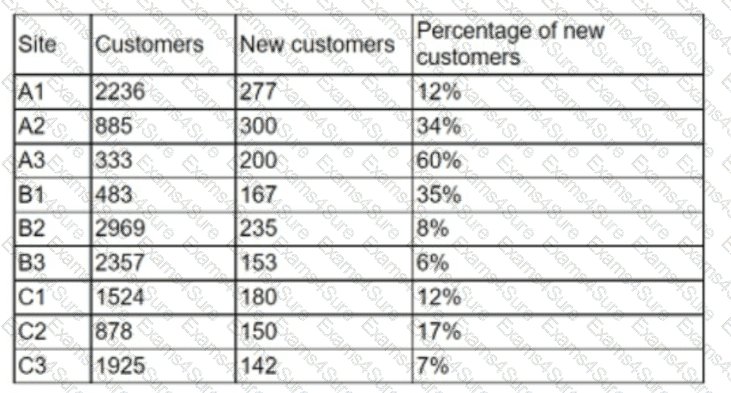
Which of the following types of charts should be considered to best display the data?
An analyst needs to summarize the number of people in Chicago in 2022 using the following set of data:
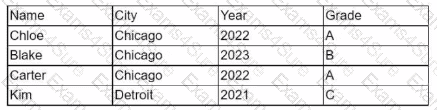
Which of the following steps should the analyst use to provide results? (Select two).