Analytics-DA-201 Practice Questions
Salesforce Certified Tableau Data Analyst
Last Update 3 days ago
Total Questions : 174
Dive into our fully updated and stable Analytics-DA-201 practice test platform, featuring all the latest Tableau Data Analyst exam questions added this week. Our preparation tool is more than just a Salesforce study aid; it's a strategic advantage.
Our free Tableau Data Analyst practice questions crafted to reflect the domains and difficulty of the actual exam. The detailed rationales explain the 'why' behind each answer, reinforcing key concepts about Analytics-DA-201. Use this test to pinpoint which areas you need to focus your study on.

You have a database that includes field named sales, City and Region.
You have the following chart that shows the number of sales made in different cities.

You want to dynamically show the corresponding region when users hover their mouse over any of the bars.
What should you do?
You plan to create a visualization that has a dual axis chart. The dual axis chart will contain a shape chart and a line chart will use the same measure named Population on the axis.
You need to configure be shapes to be much larger than the line.
What should you do?
You want to add a comment to March 2020 as shown in the following visualization.
You have the following sets in a Tableau workbook
• Top N Customers
• Customers of 2020
• Top N Products
• Sellers of 2020
Which two sets can you combine? Choose two
You publish a dashboard tut uses an attract. The extract refreshes every Monday at 10:00.
You need to ensure that the extract also refreshes on the last day of the month at 18:00.
What should you do?
You want to connect a Tableau workbook to a dataset in a Microsoft Excel spreadsheet.
What should you do from Tableau Desktop?
A colleague provides you with access to a folder that contains the following files:
• Sates.csv
• Bookl.twb
• Sates.hyper
• Export.mdb
Which He contains an extract?
You have a dashboard that contains confidential information about patients health. The data needs to always be up to date tor a team of healthcare workers How should you share me dashboard with the healthcare workers?
You are the owner of an alert.
You receive an email notification that the alert was suspended
From where can you resume the suspended alert?
You have the following dataset
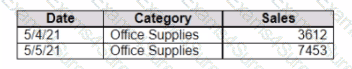
You need to create the following visualization.
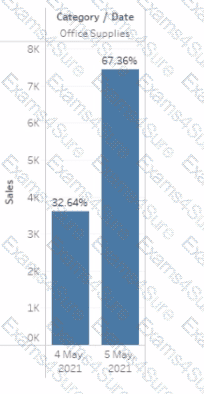
Which quick table calculation should you drag to Text on the Marks card?
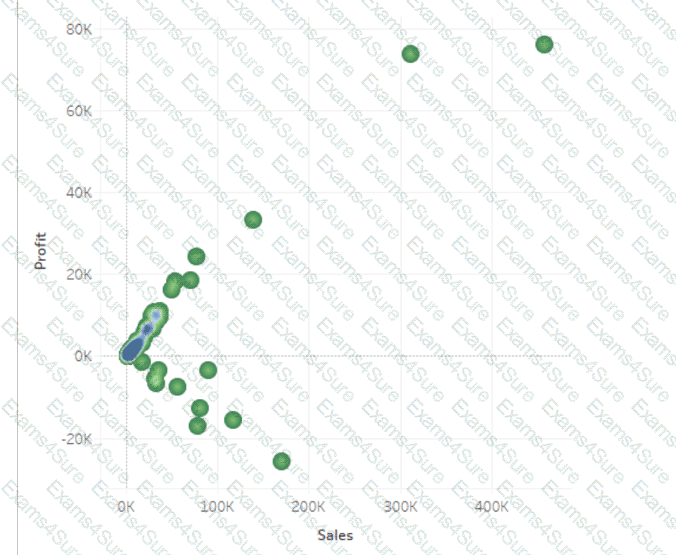
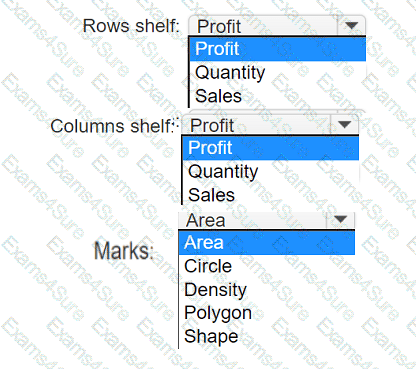
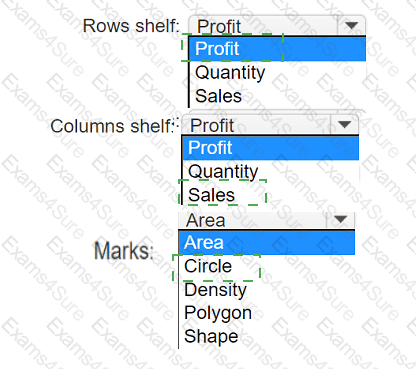
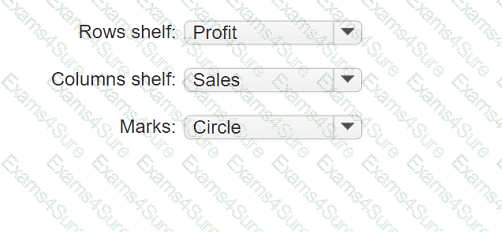
You have a data set that contains three columns named Sales, Profit, and Quantity.
You need to build the following scatter plot.