
Analytics-DA-201 Practice Questions
Salesforce Certified Tableau Data Analyst
Last Update 3 days ago
Total Questions : 174
Dive into our fully updated and stable Analytics-DA-201 practice test platform, featuring all the latest Tableau Data Analyst exam questions added this week. Our preparation tool is more than just a Salesforce study aid; it's a strategic advantage.
Our free Tableau Data Analyst practice questions crafted to reflect the domains and difficulty of the actual exam. The detailed rationales explain the 'why' behind each answer, reinforcing key concepts about Analytics-DA-201. Use this test to pinpoint which areas you need to focus your study on.

You have the following dashboard that contains two visualizations.

You want to show only one visualization at time. Users must be able to switch between visualizations.
What should you me?
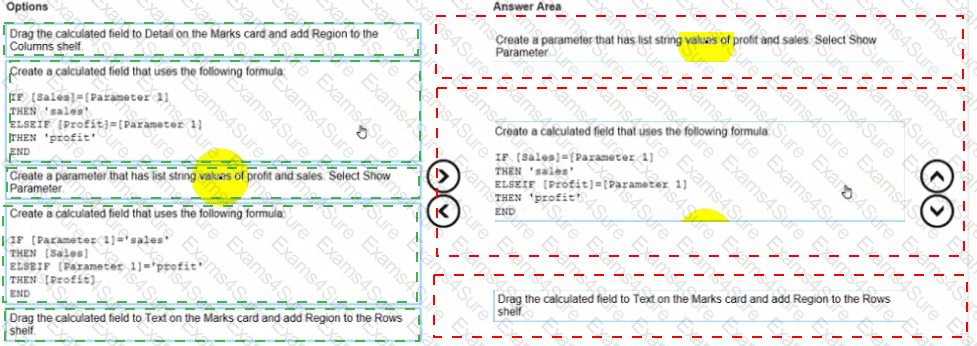
You have the following dataset.

You need to create the following worksheet.

The table must show either profit or sales based on the selection from the Parameter 1 menu.
Which three actions should you perform in orders
(Place the three correct options in order Use the arrows to move Options lo Answer Area Use Answer Area arrows to reorder the options)

You have the following dataset.

Yon need to calculate the ranking shown in the Rank field.
How should you complete the formula? (Use the dropdowns in the Answer Area to select the correct options to complete the formula ?


You have the following dataset.

Which Level of Detail (LOD) expression should you use to calculate tie grand total of all the regions?
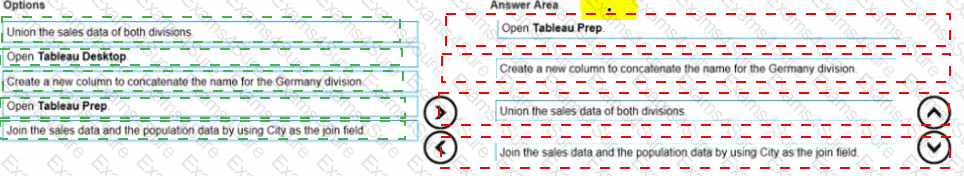
You company has two divisions located in the United States and Germany Bach division has a separate database. The following is a sample of the sales data for the division in the United States.

The following is a sample of the sales data for me division in Germany.

You have population data in a file named Populatio.csv. the following is a sample of the data.

You plan to create a visualization that ml show tie sales per capita for each salesperson Each salesperson must be identified by identified by their full name.
You need to prepare the data to support the planned visualization. The data source must support being published .
Which four actions should you perform in order?
(Place the four correct options n order Use the arrows to move Options to Answer Area arrows to re-order the options.
Use Answer Area arrows to re-order the options)

You have the Mowing dashboard.

Which two elements are floating? Choose two.
You have the following dashboard.

When a user selects a only on the map the data on the bar chart must show only the data for the selected city. The data in the bar chart must change only when the user selects a different city How should you configure the dashboard action? (Use the dropdowns in the Answers Area to select the correct options.)


You have the following data source in tableau Server.

You need to ensure that the data is updated every hour.
What should you select?
You have the following line chart that shows the average sales by month.
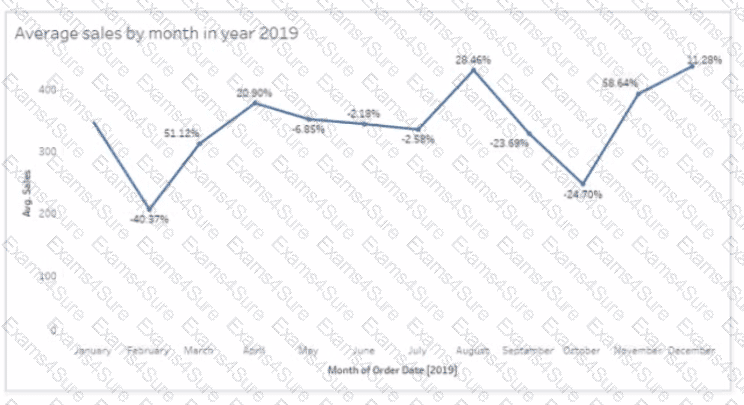
Which month had the biggest increase in swage sales compared to me previous month in 2019?
You have a line chart on a worksheet.
You want to add a comment to March 2020 as shown in the following visualization.
What should you do?