Analytics-DA-201 Practice Questions
Salesforce Certified Tableau Data Analyst
Last Update 3 days ago
Total Questions : 174
Dive into our fully updated and stable Analytics-DA-201 practice test platform, featuring all the latest Tableau Data Analyst exam questions added this week. Our preparation tool is more than just a Salesforce study aid; it's a strategic advantage.
Our free Tableau Data Analyst practice questions crafted to reflect the domains and difficulty of the actual exam. The detailed rationales explain the 'why' behind each answer, reinforcing key concepts about Analytics-DA-201. Use this test to pinpoint which areas you need to focus your study on.

You have a Tableau workbook.
You want to make the workbook available in Tableau Online.
What should you do?
A Data Analyst has two tables named EmployeeInfo and DepartmentInfo. EmployeeInfo contains four fields named Full Name, Department ID, Start Date, and Salary. DepartmentInfo contains four fields named Department Name, Size, Department ID, and VP. The analyst wants to combine the tables to meet the following requirements:
EmployeeInfo is the first table that is dragged to the canvas,
The records must contain the Full Name, and the Department Name, Size, and VP fields if available,
Not all records have an exact match.
Which type of join should the analyst use?
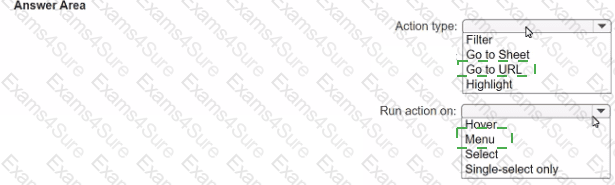
You want to ensure that when you click a bar on a dashboard, a tooltip appears that contains a link named " Click here to know more! " as shown in the following exhibit.


A Data Analyst creates the following story that contains two story points.
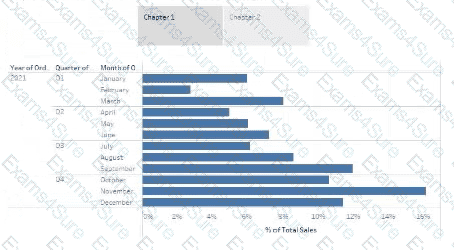
The analyst wants to change the story point format to show the current story point number out of the total number of story points.
Which Layout option should the analyst use?
When using a Show/Hide button in Tableau, what happens if the object is in a Tiled layout container?
A Data Analyst has a large data source that contains more than 10 million rows. Users can filter the rows by a field named Animal.
The following is a sample of the data.
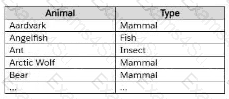
The analyst wants to ensure that every calculation is affected by including only animals of a particular type.
Which type of filter should the analyst create on the worksheet?
Open the link to Book1 found on the desktop. Open the CategoryPercentage worksheet.
Modify the bar chart show the percentage of sales for each Subcategory within every Category. The total percentage for every Category must be 100%.

Open the link to Book1 found on the desktop. Use the Superstore data source.
Split the Customer Name field into two fields named First Name and Last Name.

Open the link to Book1 found on the desktop. Open the Movie Durations worksheet.
Replace the existing data source with the Netflix_2019 data source.

Open the link to Book1 found on the desktop. Open Disciplines worksheet.
Filter the table to show the Top 10 NOC based on the number of medals won.