Free Microsoft Power BI Data Analyst Practice Questions
- Home
- Microsoft
- Microsoft Certified: Power BI Data Analyst Associate
- PL-300
- Microsoft Power BI Data Analyst
UESTION NO: 7
You have a report that contains a bar chart and a column chart. The bar chart shows customer count by
customer segment. The column chart shows sales by month.
You need to ensure that when a segment is selected in the bar chart, you see which portion of the total sales for the month belongs to the customer segment.
How should the visual interactions be set on the column chart when the bar chart is selected?
Options:
A.
no impact
B.
highlight
C.
filter
You have a CSV file that contains user complaints. The file contains a column named Logged. Logged contains the date and time each compliant occurred. The data in Logged is in the fol-lowing format: 2018-12-31 at 08:59. You need to be able to analyze the complaints by the logged date and use a built-in date hierarchy. What should you do?
Options:
A.
Create a column by example that starts with 2018-12-31.
B.
Apply a transformation to extract the last 11 characters of the Logged column and set the data type of the new column to Date.
C.
Apply a transformation to extract the first 11 characters of the Logged column.
D.
split the Logged column by using at as the delimiter.
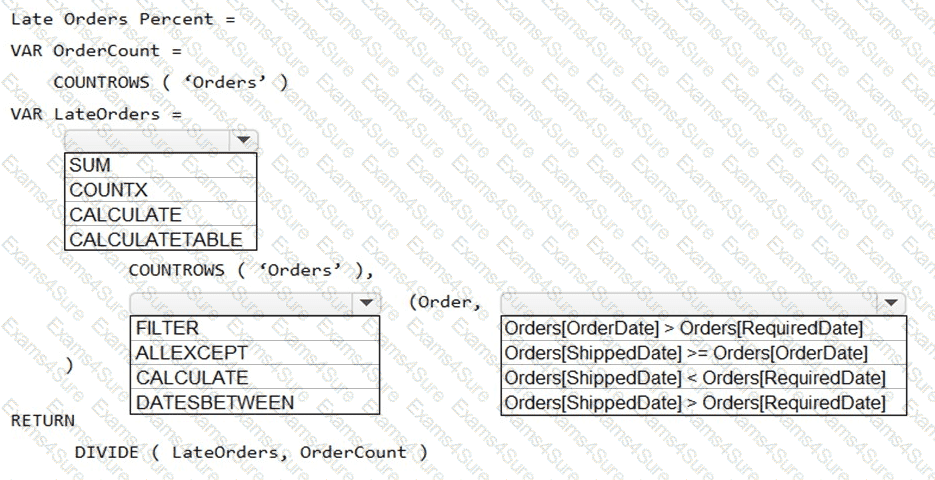
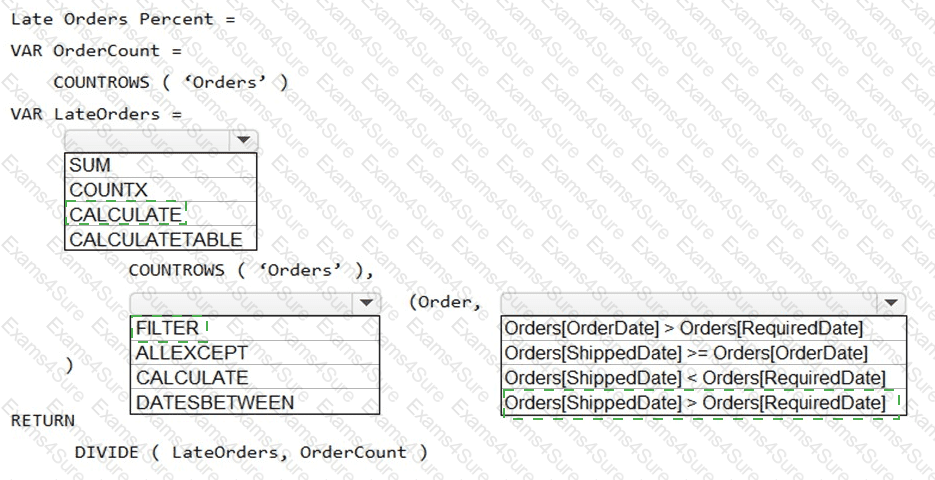
You need to create a measure that will return the percentage of late orders.
How should you complete the DAX expression? To answer, select the appropriate options in the answer area.
NOTE: Each correct selection is worth one point.
Options:
Answer:
Explanation:
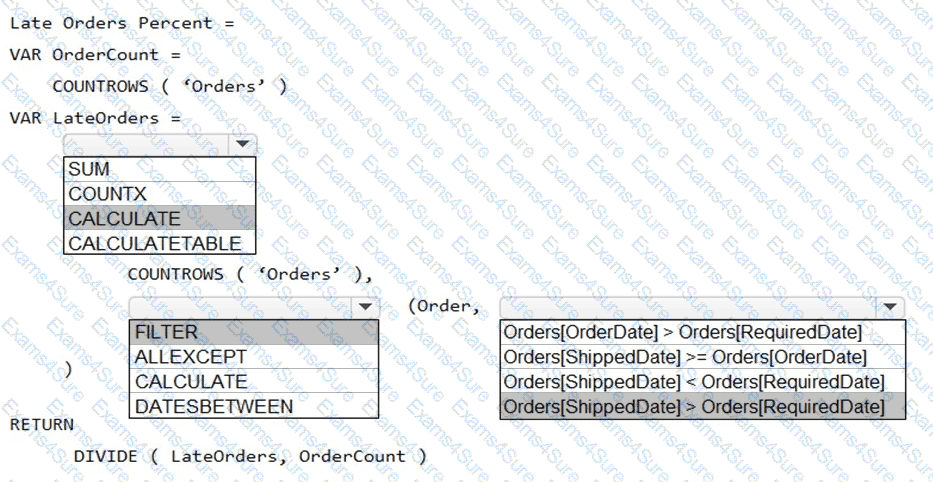
Box 1: CALCULATE
CALCULATE evaluates an expression in a modified filter context.
Syntax: CALCULATE(
Expression - The expression to be evaluated.
filter1, filter2,… (Optional) Boolean expressions or table expressions that defines filters, or filter modifier functions.
Box 2: FILTER
FILTER returns a table that represents a subset of another table or expression.
Syntax: FILTER(