
PL-300 Practice Questions
Microsoft Power BI Data Analyst
Last Update 4 days ago
Total Questions : 464
Dive into our fully updated and stable PL-300 practice test platform, featuring all the latest Microsoft Certified: Power BI Data Analyst Associate exam questions added this week. Our preparation tool is more than just a Microsoft study aid; it's a strategic advantage.
Our free Microsoft Certified: Power BI Data Analyst Associate practice questions crafted to reflect the domains and difficulty of the actual exam. The detailed rationales explain the 'why' behind each answer, reinforcing key concepts about PL-300. Use this test to pinpoint which areas you need to focus your study on.

You have a Power BI dashboard that displays different visualizations of company sales.
You enable Q&A on the dashboard.
You need to provide users with sample questions that they can ask when using Q&
A.
Which settings should you modify from the Power BI Settings?
You are creating an analytics report that will consume data from the tables shown in the following table.
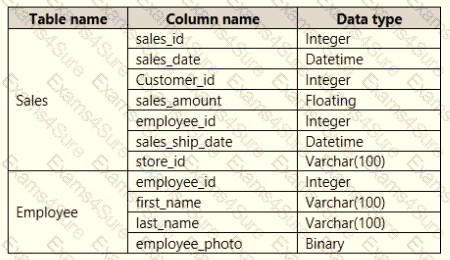
There is a relationship between the tables.
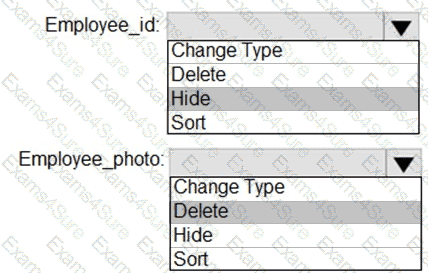
There are no reporting requirements on employeejd and employee_photo.
You need to optimize the data model
What should you configure for employeejd and employee.photo? To answer, select the appropriate options in the answer area.


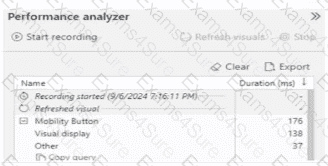
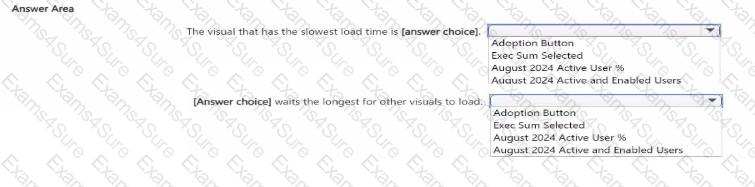
You have the Performance analyzer results shown in the following exhibit.

You are creating a line chart in a Power Bl report as shown in the following exhibit.
Use the drop-down menus to select the answer choice that completes each statement based on the information presented in the graphic.
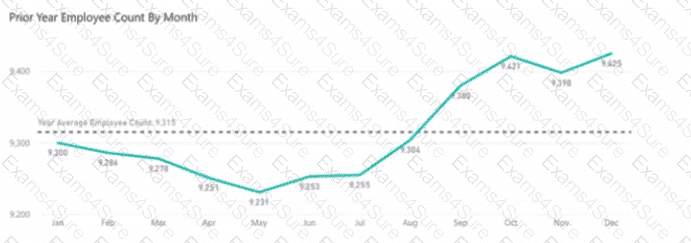
NOTE: Each correct selection is worth one point.


You are creating a Microsoft Power Bl model that has two tables named CityData and Sales. CityData contains only the data shown in the following table.
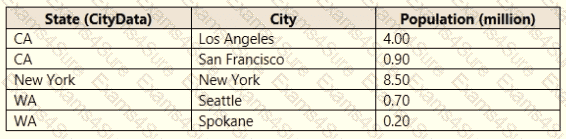
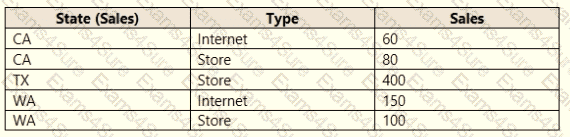
Sales contains only the data shown in the following table.
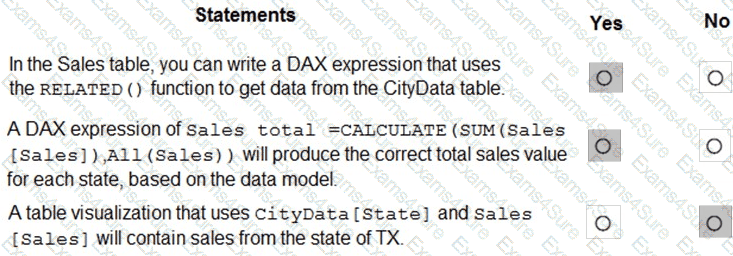
For each of the following statements, select Yes if the statement is true. Otherwise, select No.
NOTE: Each correct selection is worth one point.


You have a Power Bl model that contains two tables named Population and Date.
The Population table contains two columns named Population Amount and Date Key.
DateKey contains date values that represent the first day of a year and are used to create a many-to
The Power Bl model contains two measures that have the following definitions.
Total Population = Sum ('Population'[Population Amount])
2023 Population = CALCULATE ([Total Population]"Date'[Year] = 2023)
You create a table visual that displays Date[Year] and [2023 Population].
What will the table visual show?
You need to create a visual as shown in the following exhibit.
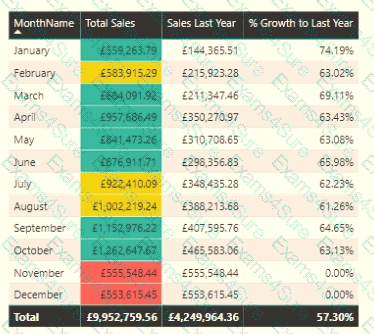
The indicator color for Total Sales will be based on % Growth to Last Year.
The solution must use the existing calculations only.
How should you configure the visual? To answer, select the appropriate options in the answer area.
NOTE: Each correct selection is worth one point.


You have a Microsoft SharePoint Online site that contains several document libraries. One of the document libraries contains manufacturing reports saved as Microsoft Excel files. All the manufacturing reports have the same data structure.
You need to load only the manufacturing reports to a table for analysis.
What should you do in Microsoft Power Bl Desktop?
You are creating a new semantic model in Microsoft Power Bl Desktop.
You connect to a recently used data source and receive an error message indicating that the password is expired.
You need to update the credentials for the data source.
What should you do?
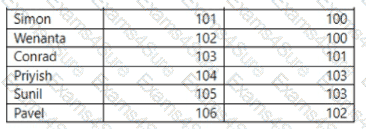
Each employee has one manager as shown in the ParentEmployeelD column,
All reporting paths lead to the CEO at the top of the organizational hierarchy.
You need to create a calculated column that returns the count of levels from each employee to the CEO.
Which DAX expression should you use?