
PL-300 Practice Questions
Microsoft Power BI Data Analyst
Last Update 4 days ago
Total Questions : 464
Dive into our fully updated and stable PL-300 practice test platform, featuring all the latest Microsoft Certified: Power BI Data Analyst Associate exam questions added this week. Our preparation tool is more than just a Microsoft study aid; it's a strategic advantage.
Our free Microsoft Certified: Power BI Data Analyst Associate practice questions crafted to reflect the domains and difficulty of the actual exam. The detailed rationales explain the 'why' behind each answer, reinforcing key concepts about PL-300. Use this test to pinpoint which areas you need to focus your study on.

You have a Power BI report that contains a page. The page contains the following visuals:
• A card
• A matrix
• A bar chart
You need to configure the page to ensure that the card and the bar chart are unaffected when a user drills down in the matrix The card and the bar chart must change when a user selects a cell in the matrix.
What should you configure? To answer, select the appropriate options in the answer area.


-
You are using Power Query Editor to preview the data in a column named Max Temp. The column statistics and value distribution are shown in the following exhibit.
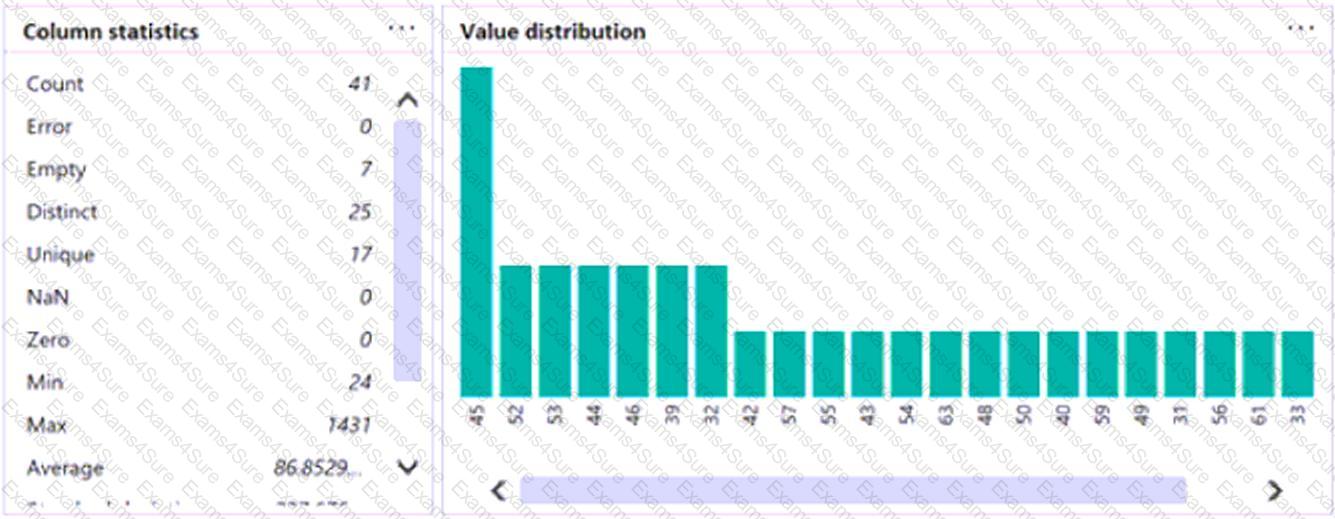
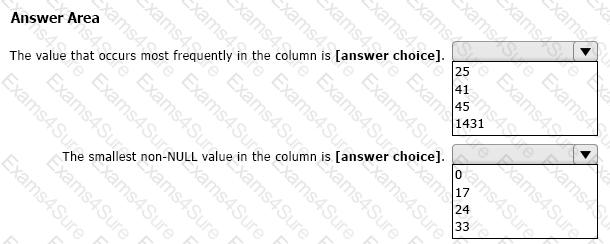
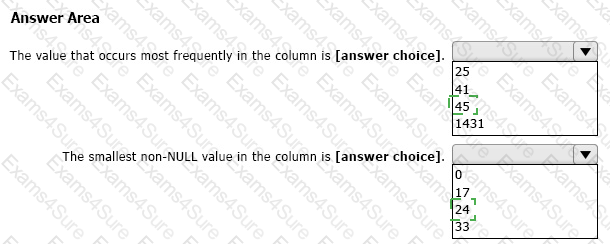
Use the drop-down menus to select the answer choice that completes each statement based on the information presented in the graphic.
NOTE: Each correct selection is worth one point.

You have a prospective customer list that contains 1,500 rows of data. The list contains the following fields:
First name
Last name
Email address
State/Region
Phone number
You import the list into Power Query Editor.
You need to ensure that the list contains records for each State/Region to which you want to target a marketing campaign.
Which two actions should you perform? Each correct answer presents part of the solution.
NOTE: Each correct selection is worth one point.
You create a data model in Power BI.
Report developers and users provide feedback that the data model is too complex.
The model contains the following tables.
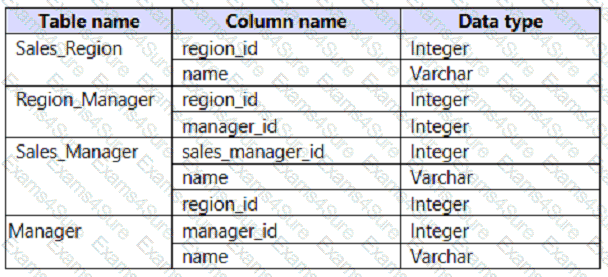
The model has the following relationships:
*There is a one-to-one relationship between Sales_Region and Region_Manager.
*There are more records in Manager than in Region_Manager, but every record in Region_Manager has a corresponding record in Manager.
*There are more records in Sales_Manager than in Sales_Region, but every record in Sales_Region has a corresponding record in Sales_Manager.
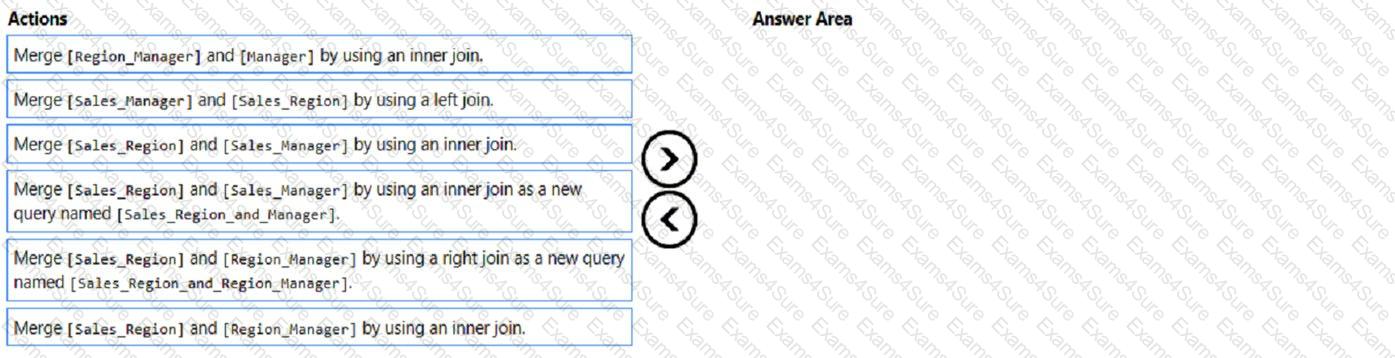
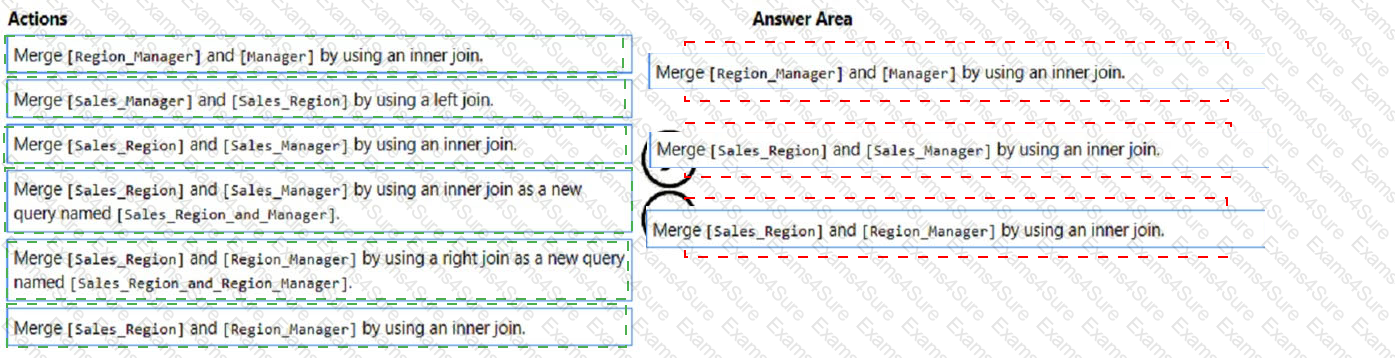
You need to denormalize the model into a single table. Only managers who are associated to a sales region must be included in the reports.
Which three actions should you perform in sequence? To answer, move the appropriate actions from the list of actions to the answer area and arrange them in the correct order.
NOTE: More than one order of answer choices is correct. You will receive credit for any of the correct orders you select.
You have a Microsoft Excel workbook that contains two tables.
From Power BI, you create a dashboard that displays data from the tables.
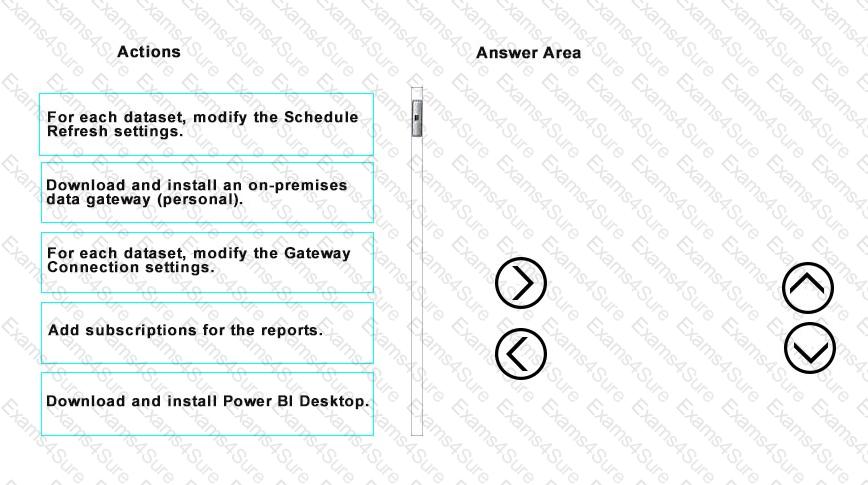
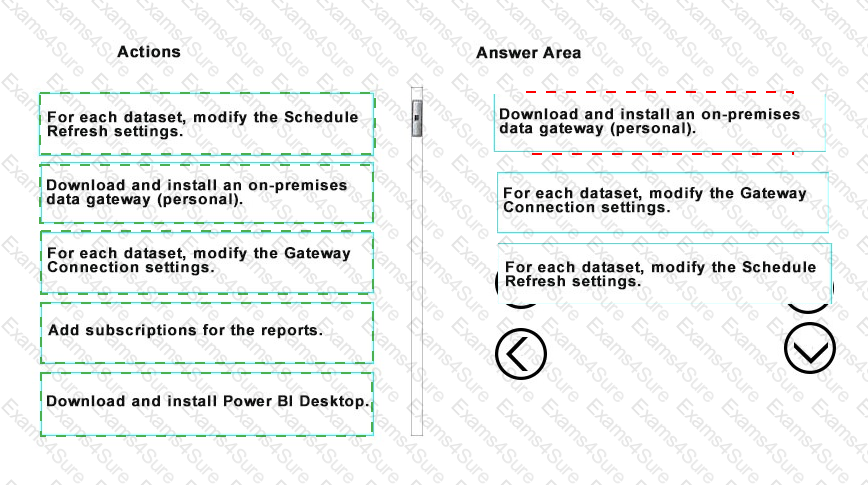
You update the tables each day.
You need to ensure that the virtualizations in the dashboard are updated daily.
Which three actions should you perform in sequence? To answer, move the appropriate actions from the list of actions to answer area and arrange them in the correct order.
You have a Power Bl report that contains a table visual with a measure named Revenue. The Revenue measure returns values within a range of 0 to S. You need to formal the visual so that the Revenue column displays a specific background color based on the value range shown in the following table.
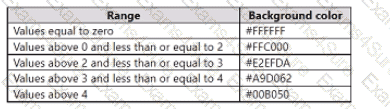
Which three actions should you perform in sequence in Power B) Desktop? To answer, move the appropriate actions from the list of actions to the answer area and arrange them in the correct order.


NO: 18
You embed a Power BI report in a Microsoft SharePoint Online page.
A user name User1 can access the SharePoint Online page, but the Power BI web part displays the following error message: “This content isn’t available”.
User1 is unable to view the report.
You verify that you can access the SharePoint Online page and that the Power BI report displays as expected.
You need to ensure that User1 can view the report form SharePoint Online.
What should you do?
You have the Power Bl data model shown in the following exhibit.
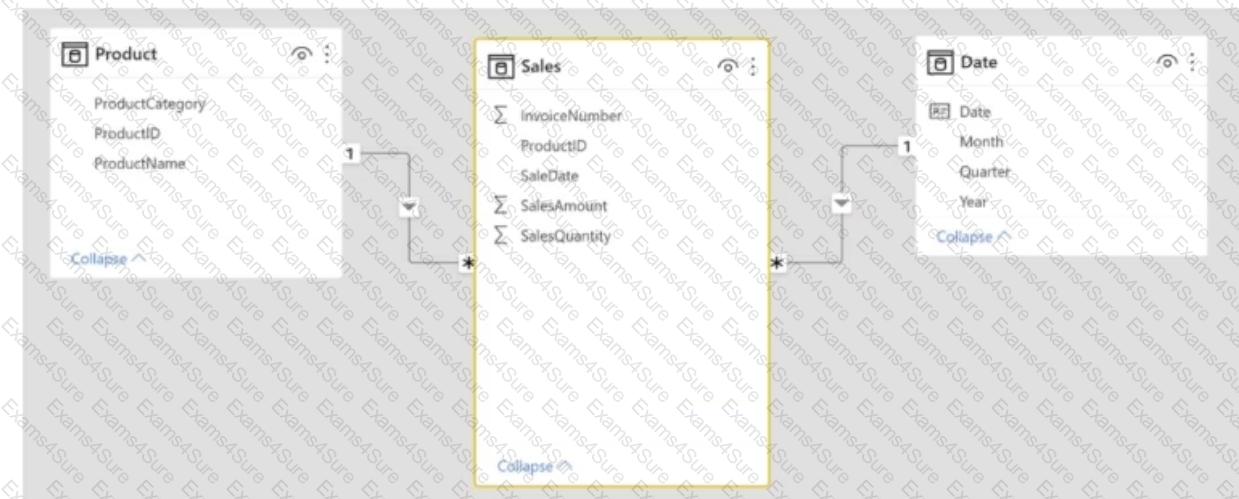
You need to create a measure to count the number of product categories that had products sold during a selected period. How should you complete the DAX expression? To answer, select the appropriate options in the answer area. NOTE: Each correct selection is worth one point.


You have a Power Bl query named Sates that imports the columns shown in the following table.
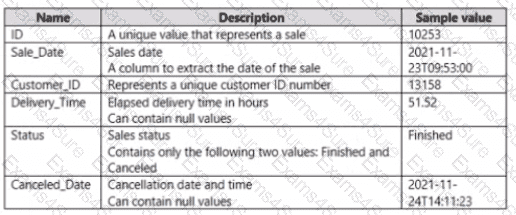
Usees only use the dale part of the Sales.Date field. Only rows with a Status of Finished are used in analysis.
You need to reduce the load times of the query without affecting the analysis.
Which two actions achieve this goal? Each correct answer presents a complete solution.
NOTL Each correct selection is worth one pant.
You plan to embed multiple visualization in a public website.
Your Power BI infrastructure contains the visualizations configured as shown in the following table.
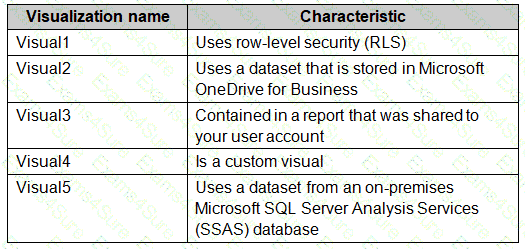
Which two visualizations can you embed into the website? Each correct answer presents a complete the solution.
NOTE: Each correct selection is worth one point.