Pre-Summer Sale Limited Time 65% Discount Offer - Ends in 0d 00h 00m 00s - Coupon code: 65pass65

PL-300 Microsoft Power BI Data Analyst is now Stable and With Pass Result | Test Your Knowledge for Free

Exams4sure Dumps

PL-300 Practice Questions

Microsoft Power BI Data Analyst

Last Update 4 hours ago
Total Questions : 464

Dive into our fully updated and stable PL-300 practice test platform, featuring all the latest Microsoft Certified: Power BI Data Analyst Associate exam questions added this week. Our preparation tool is more than just a Microsoft study aid; it's a strategic advantage.

Our free Microsoft Certified: Power BI Data Analyst Associate practice questions crafted to reflect the domains and difficulty of the actual exam. The detailed rationales explain the 'why' behind each answer, reinforcing key concepts about PL-300. Use this test to pinpoint which areas you need to focus your study on.

PL-300 PDF

PL-300 PDF (Printable)
$48.3
$137.99

PL-300 Testing Engine

PL-300 PDF (Printable)
$52.5
$149.99

PL-300 PDF + Testing Engine

PL-300 PDF (Printable)
$65.45
$186.99
Question # 41

You need to recommend a strategy to consistently define the business unit, department, and product category data and make the data usable across reports.

What should you recommend?

Options:

A.  

Create a shared dataset for each standardized entity.

B.  

Create dataflows for the standardized data and make the dataflows available for use in all imported datasets.

C.  

For every report, create and use a single shared dataset that contains the standardized data.

D.  

For the three entities, create exports of the data from the Power Bl model to Excel and store the data in Microsoft OneDrive for others to use as a source.

Discussion 0
Question # 42

Which DAX expression should you use to get the ending balances in the balance sheet reports?

Options:

A.  

CALCULATE (SUM( BalanceSheet [BalanceAmount] ),DATESQTD( 'Date'[Date] ))

B.  

CALCULATE (SUM( BalanceSheet [BalanceAmount] ),LASTDATE( 'Date'[Date] ))

C.  

FIRSTNONBLANK ( 'Date' [Date]SUM( BalanceSheet[BalanceAmount] ))

D.  

CALCULATE (MAX( BalanceSheet[BalanceAmount] ),LASTDATE( 'Date' [Date] ))

Discussion 0
Question # 43

Which two types of visualizations can be used in the balance sheet reports to meet the reporting goals? Each correct answer presents part of the solution.

NOTE: Each correct selection is worth one point.

Options:

A.  

a line chart that shows balances by quarter filtered to account categories that are long-term liabilities.

B.  

a clustered column chart that shows balances by date (x-axis) and account category (legend) withoutfilters.

C.  

a clustered column chart that shows balances by quarter filtered to account categories that are long-term liabilities.

D.  

a pie chart that shows balances by account category without filters.

E.  

a ribbon chart that shows balances by quarter and accounts in the legend.

Discussion 0
Question # 44

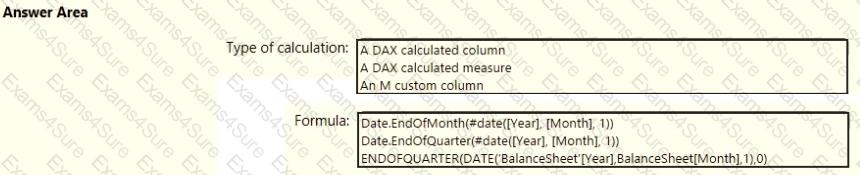
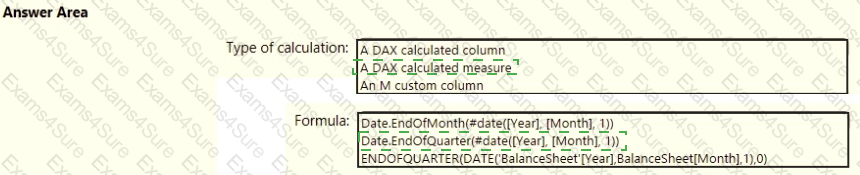
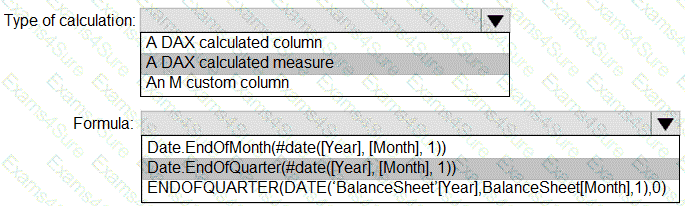
You need to calculate the last day of the month in the balance sheet data to ensure that you can relate the balance sheet data to the Date table. Which type of calculation and which formula should you use? To answer, select the appropriate options in the answer area. NOTE: Each correct selection is worth one point.

Question # 44

Options:

Discussion 0
Question # 45

You need to design the data model to meet the report requirements.

What should you do in Power BI Desktop?

Options:

A.  

From Power Query, use a DAX expression to add columns to the Orders table to calculate the calendar quarter of the OrderDate column, the calendar month of the OrderDate column, the calendar quarter of the ShippedDate column, and the calendar month of the ShippedDate column.

B.  

From Power Query, add columns to the Orders table to calculate the calendar quarter and the calendar month of the OrderDate column.

C.  

From Power Bl Desktop, use the Auto date/time option when creating the reports.

D.  

From Power Query, add a date table. Create an active relationship to the OrderDate column in the Orders table and an inactive relationship to the ShippedDate column in the Orders table.

Discussion 0
Question # 46

You use Power Query to import two tables named Order Header and Order Details from an Azure SQL database. The Order Header table relates to the Order Details table by using a column named Order ID in each table.

You need to combine the tables into a single query that contains the unique columns of each table.

What should you select in Power Query Editor?

Options:

A.  

Merge queries

B.  

Append queries

C.  

Combine files

Discussion 0
Question # 47

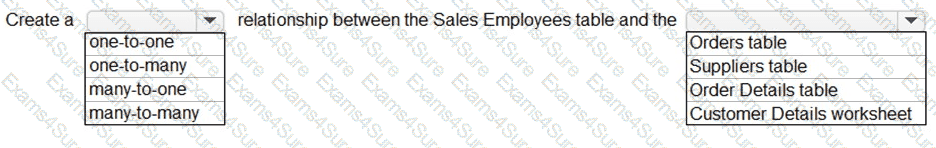
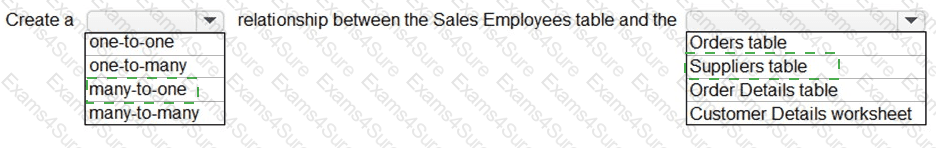
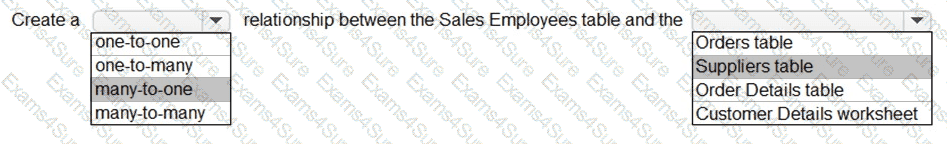
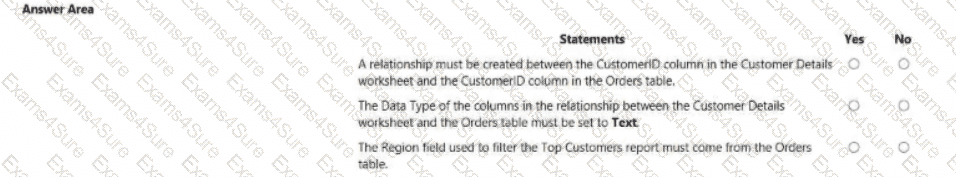
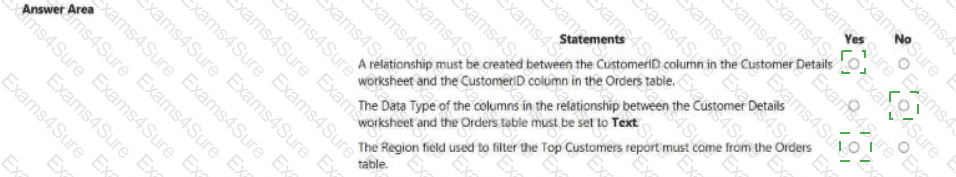
You need to design the data model and the relationships for the Customer Details worksheet and the Orders table by using Power BI. The solution must meet the report requirements.

For each of the following statement, select Yes if the statement is true, Otherwise, select No.

NOTE: Each correct selection is worth one point.

Question # 47

Options:

Discussion 0
Question # 48

You need to minimize the size of the semantic model. The solution must meet the report requirements.

What should you do?

Options:

A.  

Filter out discontinued products while importing the Products table.

B.  

Group the Categories table by the CategorylD column.

C.  

Change the OrderlD column in the Orders table to the Text data type.

D.  

Remove the QuantityPerUnit column from the Products table.

Discussion 0
Question # 49

You need to create the semantic model.

Which storage mode should you use for the tables in the semantic model?

Options:

A.  

live connection

B.  

Dual

C.  

Import

D.  

DirectQuery

Discussion 0
Question # 50

You need to create a relationship in the dataset for RLS.

What should you do? To answer, select the appropriate options in the answer area.

NOTE: Each correct selection is worth one point.

Question # 50

Options:

Discussion 0
Get PL-300 dumps and pass your exam in 24 hours!

Free Exams Sample Questions