
Exam style questions across every Analytics-DA-201 domain
Last Update 3 days ago
Total Questions : 212
Start with our free Analytics-DA-201 practice questions, carefully crafted to mirror the domains, phrasing, and difficulty of the real Tableau Data Analyst exam. Each Analytics-DA-201 exam question comes with a detailed rationale that explains not just which answer is correct but why the others fall short. That's how concepts stick. Use the free set to benchmark yourself: identify your Salesforce weak domains, see where you're losing marks, and build a focused study plan in minutes.

You are creating a new dashboard.
You need to add a button to the dashboard that allows users to export the dashboard as an image.
Which type of object should you use?
You have the following primary data source that contains a dimension named Dorm_Code.
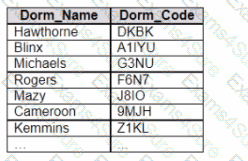
You receive the following secondary data source that contains updated dorm codes.
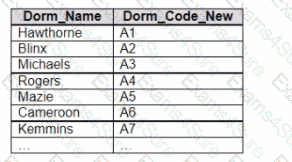
You need to bring the updated dorm codes into Tableau and use the codes in existing visualizations. The new dorm codes must use the existing field name of Dorm_Code.
What should you do?
You have the following dashboard.
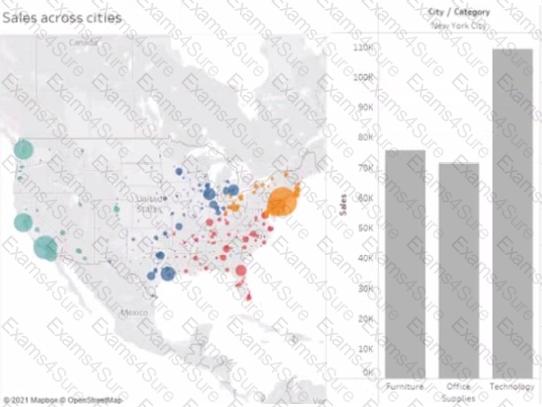
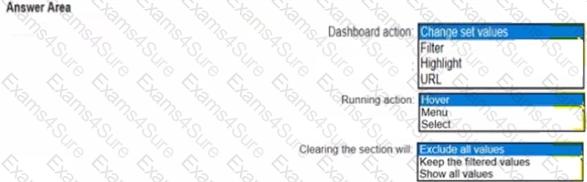
When a user selects a only on the map the data on the bar chart must show only the data for the selected city. The data in the bar chart must change only when the user selects a different city How should you configure the dashboard action? (Use the dropdowns in the Answers Area to select the correct options.)

You have a data source that contains 20 tables.
You want the tables to be organized within the Data pane based on the type of data contained within the tables.
What should you use?
A Data Analyst loads a dataset from Microsoft Excel. The following is a sample of the data.
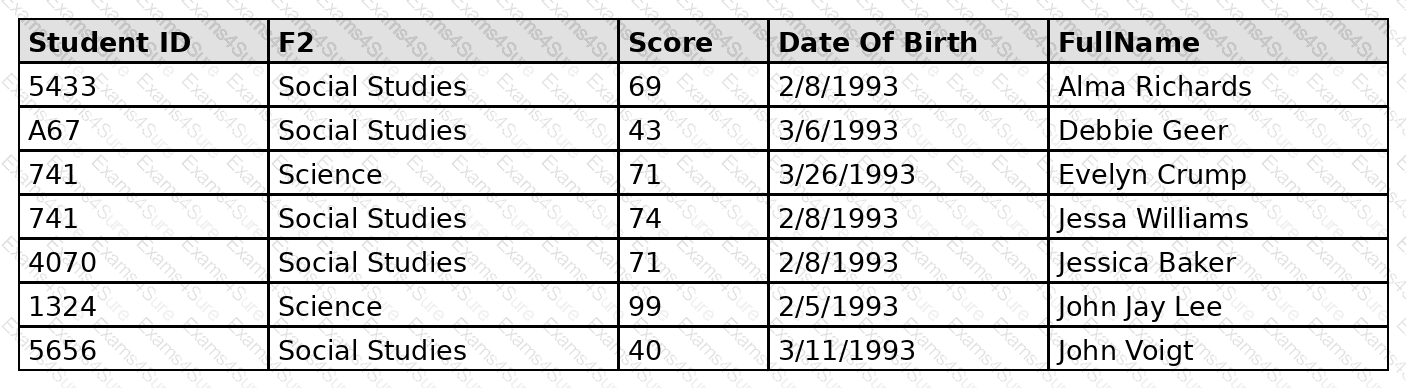
FullName contains student names. Some names contain a first name and a last name. Some names contain a first name, a middle name, and a last name.
The analyst needs to divide FullName into three separate fields: one for the first name, one for the middle name, and one for the last name. The solution must minimize effort for the analyst.
What should the analyst do?
A Data Analyst has the following two tables named Orders and Returns.
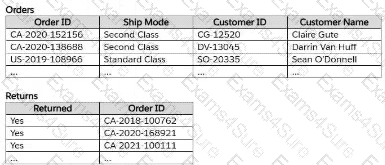
The analyst needs to get the Customer ID and Customer Name for only the orders that were returned. Orders will be the leading table.
Which type of join should the analyst perform in Tableau Prep?
You have a large data source that contains more than 10 million rows. Users can filter the rows by a field named Animal.
The following is a sample of the data.
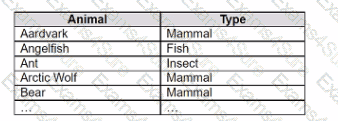
You want to improve the performance of the views by including only animals of a particular type.
To which filter should you add the Type field on the worksheet?
You create the following worksheet
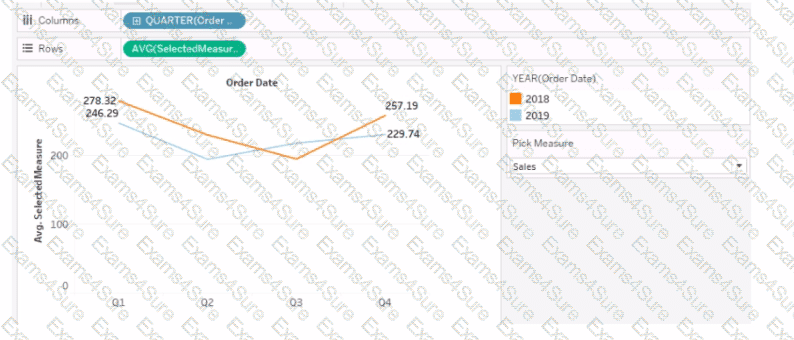
The Pick Measure parameter contains the following list of values
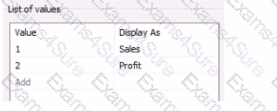
Users can select a value from Pick Measure to change the visualization to show either the Sales measure or the Profit measure.
Which formula is used in the Selected Measure calculated field lo switch between measures?
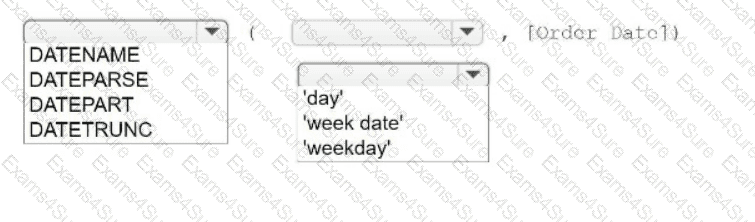
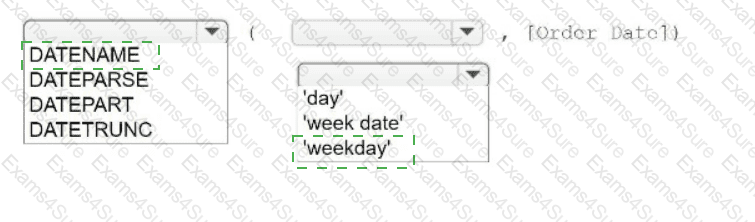
You have a table that contains four columns named Order Date, Country, Sales, and Profit.
You need to add a column that shows the day of the week for each row. For example, orders placed on August 31, 2022, will show a day of
Wednesday.
How should you complete the formula? (Use the dropdowns in the Answer Area to select the correct options to complete the formula.)
A Data Analyst needs to create a dashboard to show sales rep revenue tracking against goals. The revenue data source has already been published to the corporate Tableau site. The goals data is stored in a Microsoft Excel file and must be updated on a regular basis by the sales managers.
How should the analyst set up the data sources to meet these requirements?