
Exam style questions across every Analytics-DA-201 domain
Last Update 3 days ago
Total Questions : 212
Start with our free Analytics-DA-201 practice questions, carefully crafted to mirror the domains, phrasing, and difficulty of the real Tableau Data Analyst exam. Each Analytics-DA-201 exam question comes with a detailed rationale that explains not just which answer is correct but why the others fall short. That's how concepts stick. Use the free set to benchmark yourself: identify your Salesforce weak domains, see where you're losing marks, and build a focused study plan in minutes.

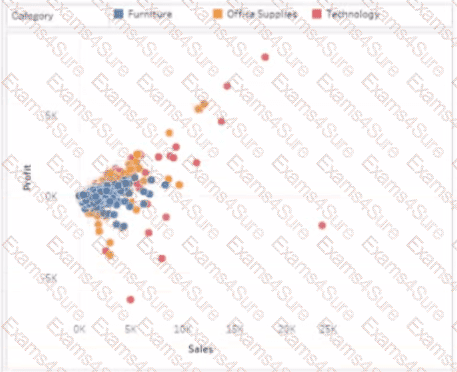
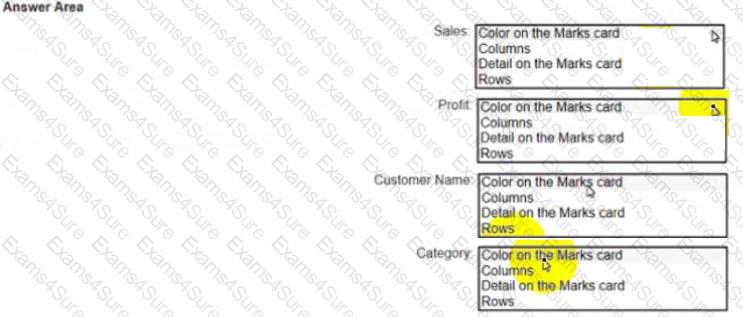
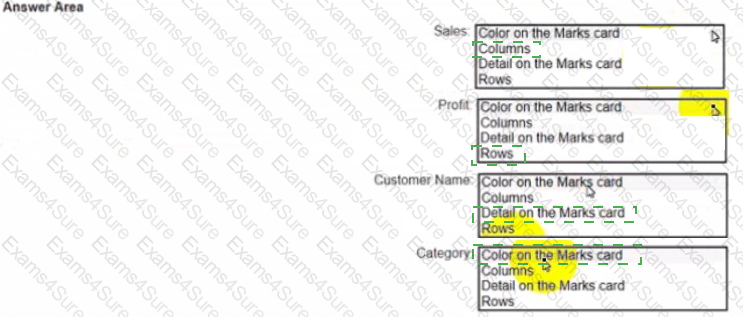
You have a dataset that has four fields named Category. Profit Sates and Customer Name. You need to create the following visualization.
A Data Analyst has the following chart that shows the number of song downloads per year since the release of the song.
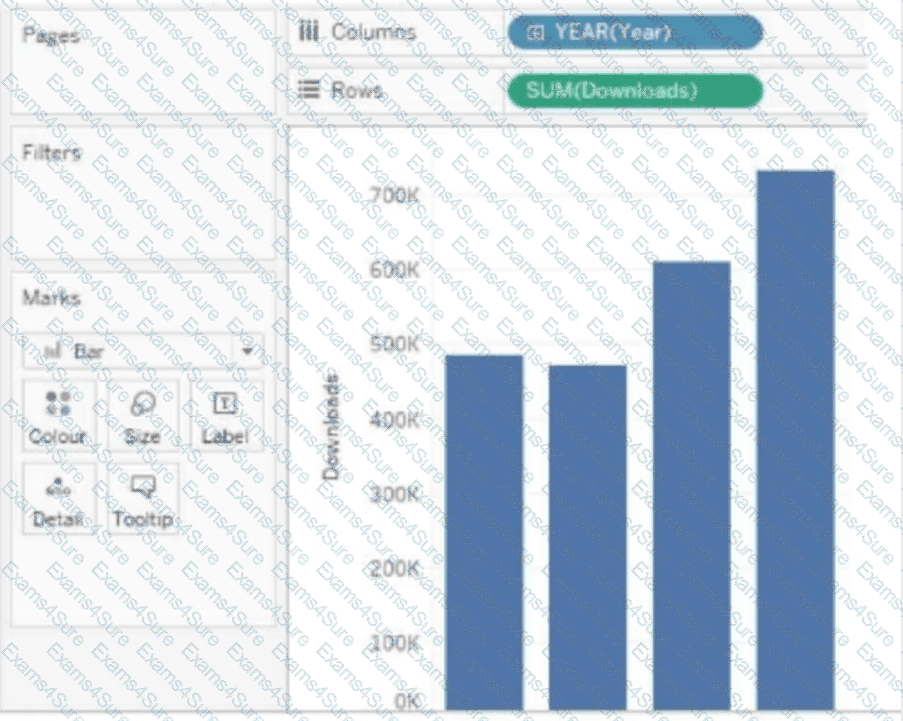
The required result is a cumulative progression of downloads across the years.
Which quick table calculation should the analyst use?
A Data Analyst has a website that displays data in a table format.
The analyst wants to connect to the data of the website by using the least amount of effort.
What should the analyst use to connect to the data?
You create the following story that contains two story point.
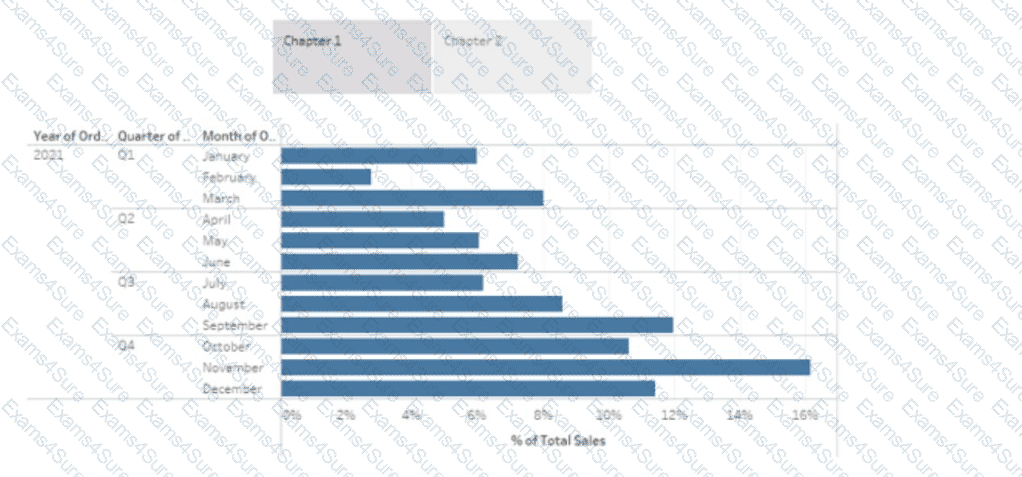
You want to change the story point format to show the current story point number out of the total number of story points.
Which Layout option should you use?
A Data Analyst has the following dataset.
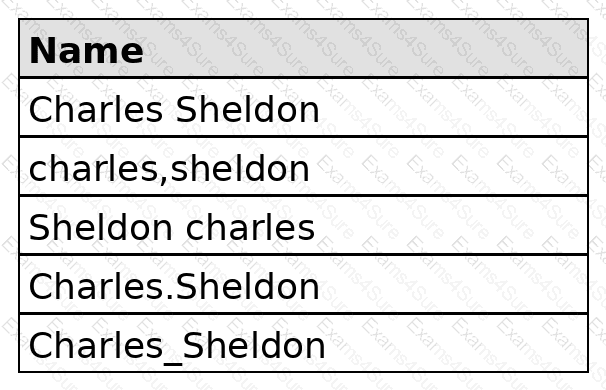
Which grouping option should the analyst use in Tableau Prep to group all five names automatically?
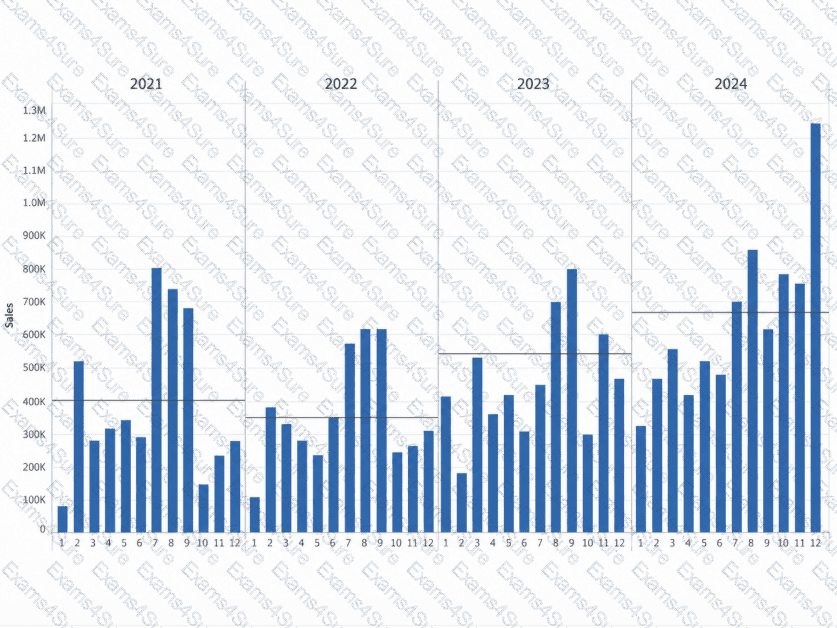
How should a Data Analyst configure the reference lines so that they appear as shown in the following chart?
A Data Analyst is creating a new data source made up of multiple tables and decides to use relationships during the creation process.
What is the advantage of using a relationship?
You have a table that contains the following data.
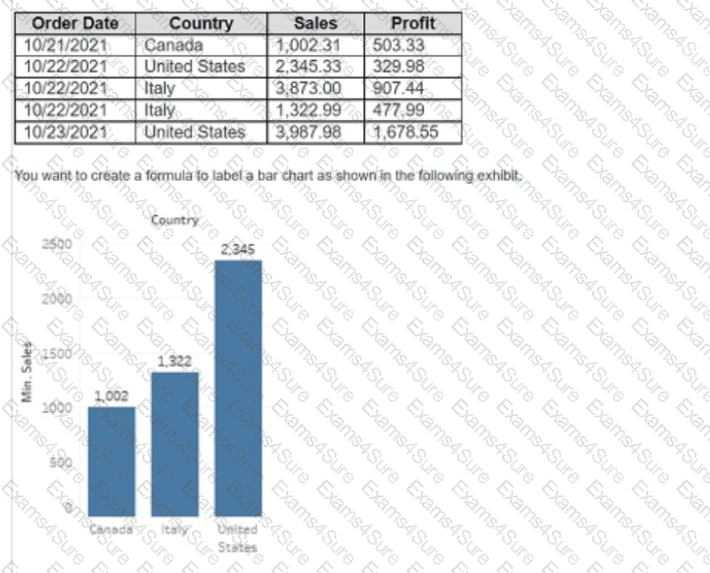
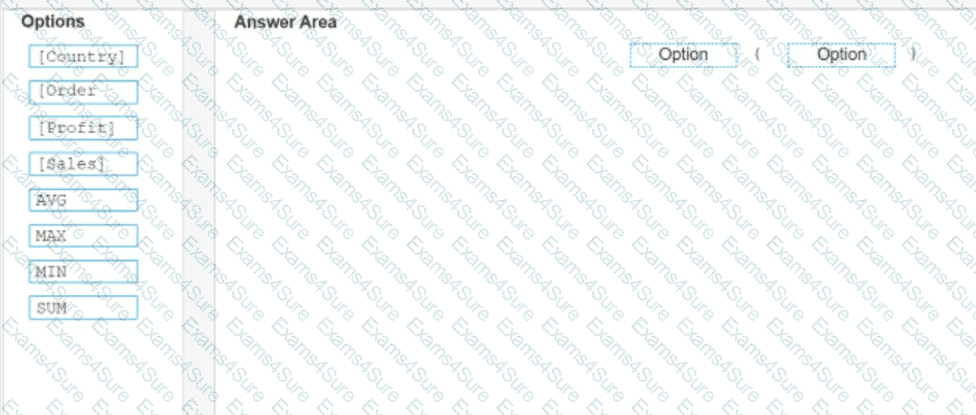
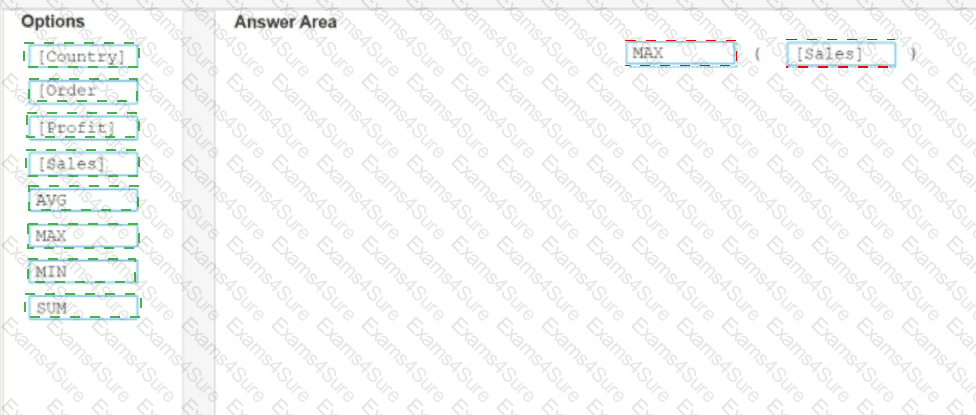
How should you complete the formula? (Drag the appropriate Options to the Answer Area and drop into the correct locations.)

You have the following visualization.
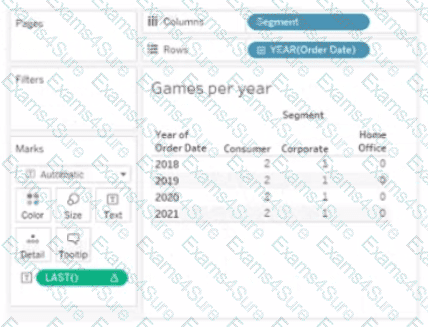
The Last() calculation is set to compute using Table (across)
Which value will appear in the crosstab for the Consumer segment of the year 2018 if you change compute to use Oder Dale?
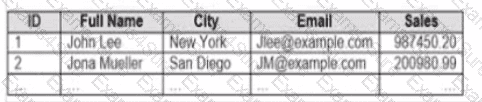
You company has two divisions located in the United States and Germany Bach division has a separate database. The following is a sample of the sales data for the division in the United States.
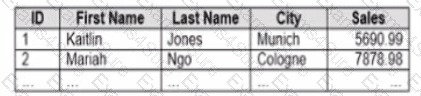
The following is a sample of the sales data for me division in Germany.
You have population data in a file named Populatio.csv. the following is a sample of the data.
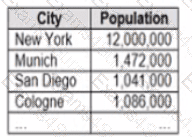
You plan to create a visualization that ml show tie sales per capita for each salesperson Each salesperson must be identified by identified by their full name.
You need to prepare the data to support the planned visualization. The data source must support being published .
Which four actions should you perform in order?
(Place the four correct options n order Use the arrows to move Options to Answer Area arrows to re-order the options.
Use Answer Area arrows to re-order the options)